Platform audit logs
The platform-level audit log captures activity across every org on the platform — a much broader scope than the per-org log a national admin sees. Use it for security investigations, compliance reviews, and forensics that span more than one tenant.
What the audit log captures
Each audit log entry records:
- Action verb —
CREATE,READ,UPDATE, orDELETE. The verb maps directly to the HTTP method that triggered the request (POST→CREATE,GET→READ,PUT/PATCH→UPDATE,DELETE→DELETE). - Actor — the user who took the action (or "system" for background jobs).
- Resource type — a string identifying what was acted on (
member,chapter,org-settings,dues,compliance,election,forum-moderation,member-profile,member-status-change,member-add-request,membership,admins,storage-config,finances,ai-services-config,sso,platform). - Resource ID — UUID of the affected row, when applicable.
- Org ID — the org context, or empty/
Platformfor cross-tenant actions. - IP address of the request.
- Timestamp down to the second.
- Metadata — a JSON payload with the change context: HTTP method, path, response status code, request-body diff (with sensitive fields redacted), and any before/after snapshots when the originating endpoint opted into detailed snapshotting.
The 14 audit log patterns
Audit coverage was expanded significantly in v0.30. There are 14 URL patterns the platform watches, split into two tiers:
Tier 1 — full coverage (logs every HTTP method, including GET reads):
/api/finances/...— every read or write to finance endpoints/api/organizations/{org}/admins/...— admin lifecycle on a tenant/api/organizations/{org}/storage-config/...— storage config reads and writes/api/ai-services/config/...— AI provider config changes/api/members/{id}/profile/...— every profile view or edit/api/auth/sso/...— SSO sign-in flows/api/platform/...— every platform admin action
Tier 2 — write-only coverage (logs POST/PUT/PATCH/DELETE, not GET):
/api/organizations/{org}/members/...— member adds, edits, deletes/api/chapters/{chapter}/members/...— chapter-scoped member changes/api/memberships/...— direct membership writes/api/organizations/{org}/member-add-requests/...— approval workflow/api/organizations/{org}/status-change-requests/...— status approval flow/api/organizations/{org}/chapters/...— chapter writes/api/compliance/...— compliance writes/api/elections/...— election writes/api/forums/.../moderate/...— moderation actions/api/organizations/{org}/settings/...— org settings writes (general, branding, billing, AI, storage, etc.)/api/organizations/{org}/dues/...— dues writes
(There are slightly more than 14 expressions today — the 14 was the v0.30 baseline. The set grows as new modules ship.)
The split between Tier 1 and Tier 2 is deliberate: for sensitive endpoints (finances, admin lifecycle, SSO, the platform surface), every read matters. For high-volume directory and roster endpoints, logging every GET would generate millions of low-signal rows.
Change-detail capture
Where it's available, the metadata payload includes a before/after diff of the object being changed. This is most useful for UPDATE actions on org settings, admin records, storage configs, and compliance requirements — you can expand the row and see exactly which field changed from what to what.
Not every endpoint opts in to before/after snapshotting today. When the snapshot is missing, the metadata still carries the HTTP body of the request (with password, secret_key, api_key, token, credential, client_secret, and similar fields redacted to bullets), so you can still see what was sent, just not what the prior state was.
What's deliberately not logged
- Read-only browse traffic on Tier 2 endpoints. A national admin opening the members list does not generate one audit row per member.
- Sensitive query params are redacted.
?token=...,?api_key=...,?secret=...,?key=...,?access_token=...,?refresh_token=...are stripped from the logged URL. - Sensitive body fields are redacted.
password,password_confirm,api_key,secret_key,token,credential,secret_access_key,client_secret,access_token,refresh_tokenappear in the body diff as bullets.
Open platform audit logs
Platform → Audit logs.
You'll see a paginated, time-ordered table with the most recent activity at the top.
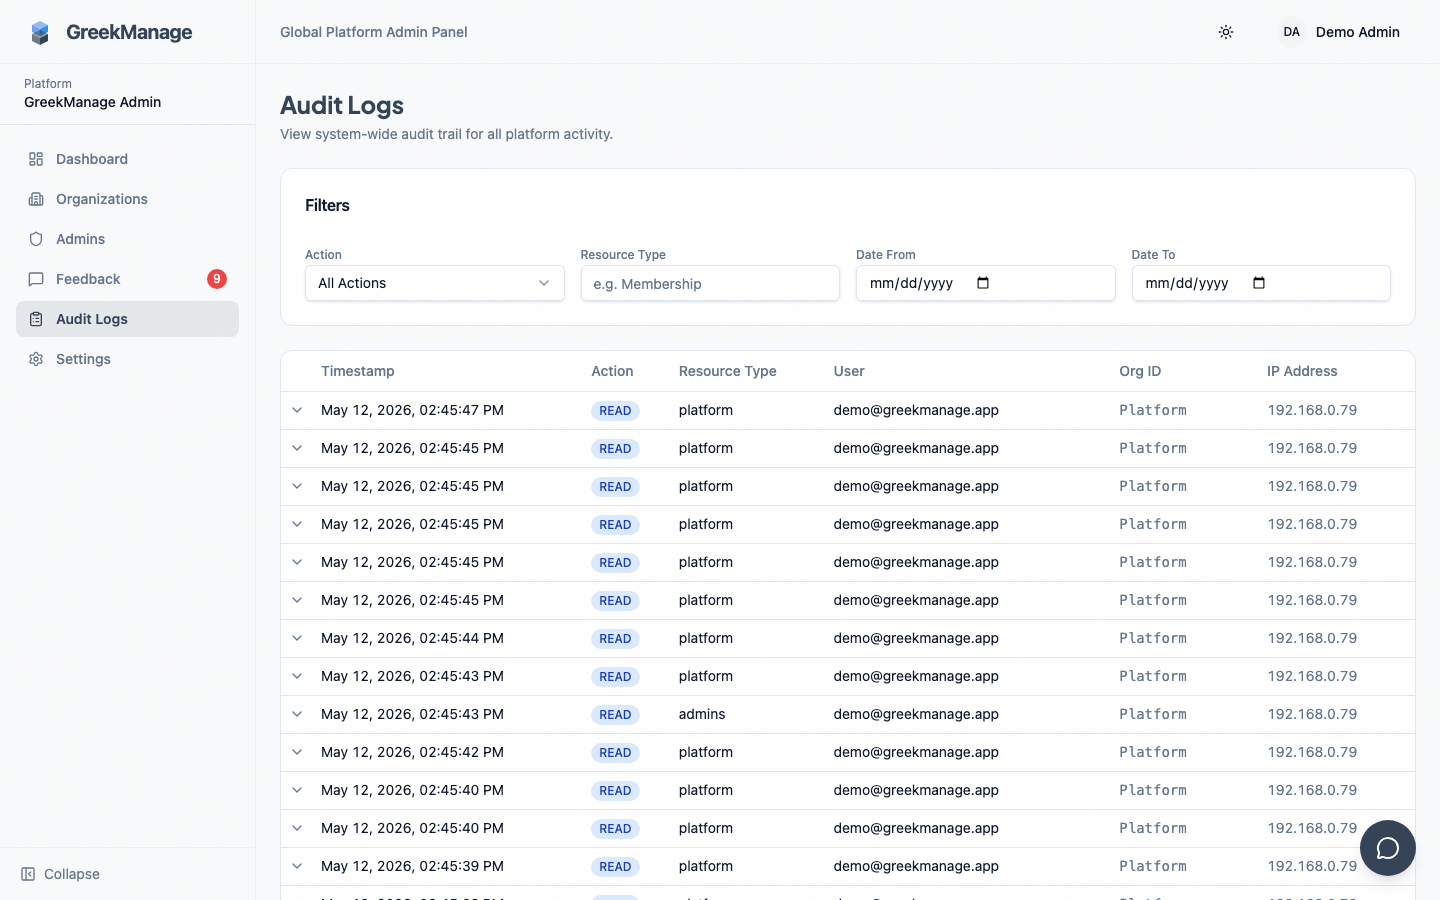 the platform audit logs table with filters expanded
Each row shows:
- Timestamp (relative — "5 minutes ago" — with absolute timestamp on hover).
- Actor — name and email (or "system" for background jobs).
- Action — colored chip (CREATE/READ/UPDATE/DELETE).
- Resource type and resource ID (truncated to first 8 characters).
- Org ID — the affected tenant, or "Platform" for cross-tenant actions.
- IP address of the request.
Click any row to expand it. The expanded view shows the full metadata JSON — HTTP method, path, response status, request body (redacted), and the before/after diff if present.
Filters
The Audit Logs screen exposes four filters today, all combinable:
- Action — dropdown for CREATE / READ / UPDATE / DELETE.
- Resource Type — free-text input, case-insensitive contains-match.
MembershipmatchesMembership,membership, and any compound type containing those characters. - Date From — start of the range.
- Date To — end of the range.
Pagination is 50 rows per page with a page-size override available via API.
Filters available in the backend but not the UI
The underlying viewset also accepts:
org_id— narrow to a single tenant.user_id— narrow to a single actor.
Both work if you call the API directly, but neither is wired into the UI today. Two consequences:
- "Show me everything user X did in the last 90 days" requires API access or a temporary frontend tweak.
- "Show me everything that happened in org Y" similarly requires API access or filtering by Org ID in your own head when scanning rows.
These two filters are on the frontend backlog for a future release.
The org-scoped audit log (the one a national admin sees) has a richer filter UI including a metadata keyword search and a distinct-users dropdown — those features didn't make it to the platform-scope view in this release.
Recent Activity rail
The org-admin Logging tab includes a Recent Activity card with the ~30 most-recent events at the top, separate from the filterable main table. The platform-scope view does not have a Recent Activity rail today — the platform table itself defaults to newest-first, which mostly covers the same need, but if you want a glanceable "what just happened across the platform?" widget, it's not on this screen yet.
Expandable detail rows
Click any row to expand. The expanded view renders the metadata JSON in a structured layout — HTTP method, path, response status code, request body with sensitive fields redacted, and (when present) before/after snapshots showing exactly which fields changed and to what.
The detail view is read-only. There's no comment / annotate / tag action — if you need to attach context to a row for a coworker, copy the row ID into a chat or ticket.
Investigation patterns
Suspected misuse of platform privilege
- Set a tight date range around the suspected window.
- Filter to
UPDATEorDELETE. - Filter Resource Type to
platformto see only platform-scoped actions. - Scan IP addresses for unfamiliar values.
- Expand suspicious rows to see the body diff.
Module flips for a tenant
Filter Resource Type to platform and scan for entries with paths under /api/platform/organizations/{org}/modules/. The body will show is_enabled: true/false and the actor.
Storage config changes
Filter Resource Type to storage-config. Expanded metadata shows region, endpoint, and the masked credential fields (you never see the real key).
Sign-in failures over time
Filter Resource Type to sso. Filter Action to CREATE (SSO sign-ins are POSTs). The metadata will distinguish success from failure via the response status code.
Compliance / election / dues changes for a specific tenant
Use the API directly with org_id={org} plus Resource Type, since the UI doesn't have an org filter yet.
Per-org retention
Retention is controlled per organization, not platform-wide. Each org has a small retention config row with:
is_enabled— whether audit logging is collected for this org at all. Defaulttrue. Setting it tofalsestops new rows being written for that tenant; existing rows are kept until trimmed by retention.retention_days— single integer between 1 and 180 days. Default 180 days (the maximum). Older rows are pruned by the retention job.
Configure it via the per-org page on the platform admin side. There is no "2 years / 7 years / permanent" tiered retention model — that was an aspirational claim and does not exist in v0.62.1. If a tenant requires longer retention for regulatory reasons, archive externally before the 180-day cap hits. The pruning job runs daily and is unforgiving.
Org admins can read the retention setting on their own org but cannot change it — see Audit log retention (org admin).
Tamper-resistance
Audit log rows are write-once in practice — there is no API surface that updates or deletes them, and the underlying viewset is read-only.
What that does not mean:
- There is no
INSERT-only database constraint or trigger today. A sufficiently privileged database user could in principle mutate or delete rows directly. - There is no cryptographic hash chain across rows; a row can be quietly removed at the database level without leaving evidence in subsequent rows.
- There is no off-site append-only archive that the application writes to in parallel.
In other words: audit logs are defense in depth, not a legally tamper-proof system. Treat them as a strong signal, not as an evidentiary record sufficient for litigation on its own. For litigation-grade preservation, you need an off-site write-once archive layered on top of the application, which is not built today.
Export
There is no in-product CSV/JSON export for audit logs at the platform scope in v0.62.1. To pull a slice of logs for ad-hoc forensics today:
- Query the
audit_logtable directly via the database (read replica recommended for large windows). - Use the per-org JSON export to pull an org's audit slice as part of its full data export (see Backups & export).
- Page through the platform audit log endpoint via the API and capture pages into a file.
A first-class CSV/JSON export at the platform scope is roadmap.
Errors and edge cases
Filter shows zero results when you know something happened. Check:
- The Resource Type filter is case-sensitive in spelling (it's a contains-match, so partial works) and won't match across types (e.g.,
Membermatchesmember-profileandmember-add-request, but notchapter). - The date range filters work in your browser's local timezone; the timestamps in the table are also displayed local. If you're looking for a UTC-noted incident, convert to local first.
Resource ID column is "Platform" instead of a UUID. That row is a cross-tenant action (e.g., a platform admin enabling a module for org X). The actual target may be in the metadata.
A row you expected isn't there. Check:
- The endpoint that fired isn't on the audit pattern list. Read endpoints in Tier 2 explicitly aren't logged.
- The retention job ran and trimmed it because it's older than the org's retention_days setting.
- Audit logging is disabled for the org (rare, but possible —
is_enabled = false).
Metadata JSON shows bullets where I expected a value. That field is in the redaction list (password, token, api_key, secret_access_key, etc.) — by design.
Same action appears twice. Two audit middleware paths can both match a request in rare cases. Treat the duplicate as harmless; an engineering ticket exists to dedupe.
Tips
- Run quarterly platform-admin audits even when there's no incident. Scan the recent module-toggle activity and admin-lifecycle changes; confirm everything was authorized.
- Archive externally before the 180-day cap if any tenant has longer regulatory retention obligations.
- Use Resource Type as your primary lens. Even though it's a free-text contains-match, it narrows the result set faster than any other filter.
- Bookmark filter combinations that you use repeatedly (date + resource type) — the URL captures filter state.
- Cross-reference with provider logs for SSO investigations. The audit row tells you what GreekManage saw; the IdP's logs tell you what the IdP saw.
Troubleshooting
| Symptom | Likely cause | Where to look |
|---|---|---|
| Resource Type input doesn't seem to filter | Click out of the input or wait — it's debounced on type | Check the resulting query params in the URL |
| Pagination shows 0 of N pages | Empty filter result; query is too narrow | Loosen date range, broaden resource type |
| Date pickers look wrong | Browser timezone vs server | Both UI and DB store UTC; UI displays local |
| Need to filter by user or org | UI doesn't expose; backend does | Call the API with org_id=... or user_id=... |
| Logs from before a certain date are missing | Retention pruning ran | Check the org's retention_days; archive externally for longer windows |
What's not built today
- CSV / JSON export at platform scope. No bulk export button; API or DB query only.
- Anomaly / threshold alerts. No "alert when more than N DELETEs from this user in a day" feature.
- Tagging / annotation on rows. Read-only.
- Saved filter presets. URL state only.
- Org and user filters in the UI. Backend supports; UI doesn't surface.
- Recent Activity rail. Org-admin view has it; platform view doesn't.
- Append-only DB enforcement or hash chain. Not a legally tamper-proof store.
- Off-site archive write-through. External archival is a manual operation.
- Tiered retention (2yr / 7yr / permanent). Max is 180 days, period.
Related
- Audit log retention (org admin) — the org-side view of the same retention model
- Managing platform admins — every platform admin change shows up here
- Backups & export — for per-org export including audit slices
- Reports & exports & audit logs (org admin)
Last verified against v0.62.1 (2026-05-11).