Platform Health & Status Dashboard
GreekManage runs one shared database, one shared Redis, one shared set of Celery workers, and one shared object-storage/backup target underneath every tenant on the platform. This page is the platform admin's consolidated view of whether that shared infrastructure — plus the integrations and scheduled jobs layered on top of it — is actually healthy right now.
What you see
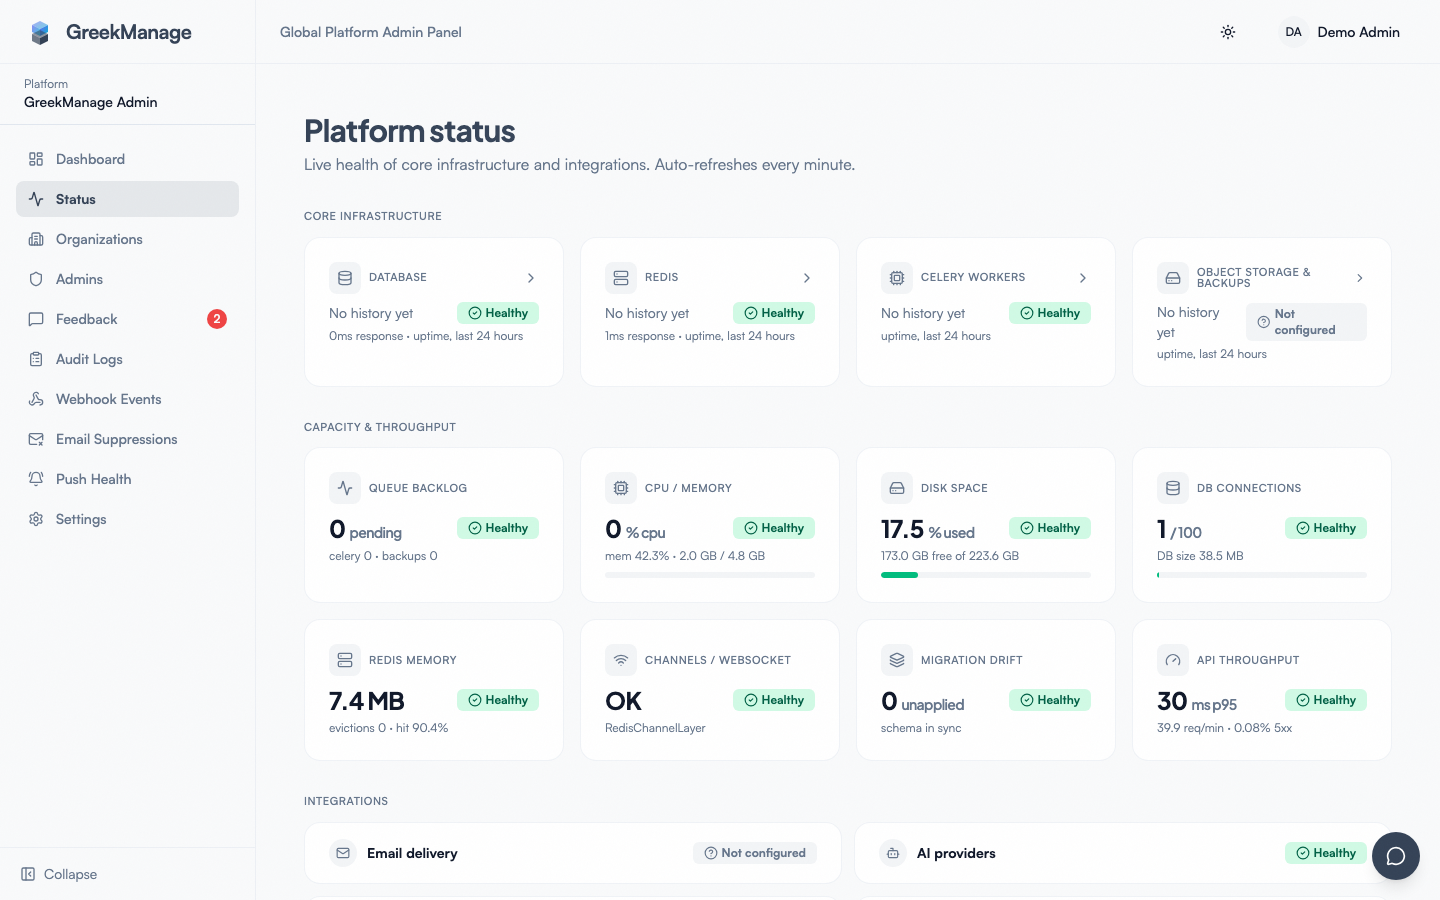 The Platform Health & Status Dashboard.
Open Platform → Status.
The page title is "Platform status", subtitled "Live health of core infrastructure and integrations. Auto-refreshes every minute." True to the subtitle, the whole page polls and re-renders every 60 seconds with no manual refresh needed.
The page is laid out in five sections, top to bottom:
- Core infrastructure — 4 cards: Database, Redis, Celery workers, Object storage & backups.
- Capacity & throughput — 8 metric cards: queue backlog, CPU/memory, disk space, DB connections, Redis memory, channels/WebSocket, migration drift, API throughput.
- Integrations — 6 tiles: Email delivery, AI providers, Payment processors, SSO/SAML, Push notifications, Stripe webhooks.
- Scheduled jobs — a table of every Celery Beat task and its last outcome.
- What these numbers mean — a short explainer, quoted in full below, that draws the line between what alerts and what doesn't.
A companion sub-page, Push delivery health, covers push-notification send outcomes in more depth — see Push delivery health below.
Core infrastructure
These 4 checks are the only ones wired into outage alerting (see When something goes down). Each is snapshotted every 5 minutes and retained for 48 hours, which is what powers the rolling 24-hour uptime percentage shown on its card.
| Component | Healthy | Degraded | Down |
|---|---|---|---|
| Database | SELECT 1 succeeds | — | any exception |
| Redis | cache check and broker check both succeed | only one of cache/broker succeeds | both fail |
| Celery workers | celery_app.control.inspect finds at least one worker (worker_count > 0) | — | no workers respond |
| Object storage & backups | configured, verified, and the last full backup did not fail | configured but unverified, or the last full backup failed | (see Not configured below) |
Object storage & backups also has a distinct Not configured state: it shows this whenever no PlatformBackupConfig row exists yet, or the row exists but is inactive. Celery workers also reports queue depths for the celery and backups queues alongside its status.
Each card shows:
- A status badge — Healthy, Degraded, Down, or Not configured.
- A rolling 24-hour uptime percentage.
- Response latency in milliseconds.
- An error message, when the component is Down.
Click the chevron on any core-infrastructure card to expand it in place. The expanded panel shows:
- A row of colored dots, one per 5-minute sample over the last 24 hours — hover any dot for a relative-time tooltip (e.g. "Healthy · 45m ago").
- A latency sparkline over the same window.
- A "Recent checks" list of the last 5 samples.
- A raw detail key-value table (the same
detailpayload the backend check returned — e.g. cache/broker sub-status for Redis, or provider/verification state for object storage).
Capacity & throughput
These 8 metrics are computed live on every page load — they are not snapshotted and not part of outage alerting. They exist to catch resource pressure before it turns into an outage. In the order they appear on the page:
- Queue backlog — combined pending-task count across the
celeryandbackupsqueues. Degraded at ≥1,000 pending, Down at ≥5,000. - CPU / memory — host utilization via
psutil. Degraded if CPU or memory usage is ≥90%. - Disk space — Degraded at ≥85% used, Down at ≥95% used.
- DB connections — active Postgres connections vs.
max_connections. Degraded at ≥90% used. - Redis memory — used vs. configured
maxmemory. Degraded at ≥90% used, only evaluated when amaxmemorycap is actually configured. - Channels / WebSocket — reachability of the Django Channels layer that powers WebSockets. Not configured if no channel layer exists, Healthy if a test send succeeds, Down on any exception.
- Migration drift — Healthy if there are zero unapplied Django migrations, Down if any exist (the first 20 unapplied migration names are listed).
- API throughput — a rolling 1-hour window of request rate (req/min), latency percentiles (p50/p95/p99), and 5xx error rate. Degraded if the error rate is ≥5% or p95 latency is ≥2,000ms; Not configured if no requests have been recorded yet in the window.
Integrations
Six tiles, each showing a Not configured / Healthy / Degraded status (Push notifications can also show Down, if either platform's 24h success rate drops below 70% — the tile keys off whichever platform is worse) and, where relevant, a "View details →" link to a deeper page:
- Email delivery
- AI providers
- Payment processors
- SSO / SAML
- Push notifications — links to Push delivery health
- Stripe webhooks — links to the Stripe webhook-event log
These tiles are informational only — nothing here pages anyone, regardless of status. A single org's payment processor or SSO connection failing doesn't affect the rest of the platform, so it doesn't trigger an alert.
Two gaps are called out directly on the page itself (not hidden or glossed over):
- SSO connections have no persisted verification state. The tile can only tell you whether a connection is configured and active — not whether it was ever actually verified to work.
- The platform-wide AI provider config has no verification flag at all, unlike its per-org counterpart (
AIConfig.is_verified). There is currently no way to know from this dashboard whether the platform-default AI provider credentials are actually valid.
Scheduled jobs
A table titled with the description "Last known outcome of each Celery Beat scheduled task." Columns are Job, Last status, and Last run, and rows are sorted failures first.
What these numbers mean
The dashboard's own explainer section (quoted in full, since it's already precise and worth reading as-is):
Core infrastructure components page platform admins (in-app and email) the moment one goes from healthy to degraded or down. Uptime % is a rolling 24-hour window from snapshots taken every 5 minutes.
Integrations are informational only — an individual org's payment processor or SSO connection failing doesn't page anyone, since it doesn't affect the rest of the platform.
Some integrations have known tracking gaps: SSO connections have no persisted verification state (only whether they're configured active), and the platform-wide AI provider config has no verification flag at all, unlike its per-org counterpart.
When something goes down
Only the 4 core-infrastructure checks — Database, Redis, Celery workers, Object storage & backups — can trigger an alert. Capacity/throughput metrics and integration tiles never do, no matter how degraded they look.
Alerting is edge-triggered, not continuous: it fires exactly once, on a healthy → degraded or healthy → down transition, at the moment a scheduled 5-minute snapshot detects the change. A component that's already unhealthy and gets worse (degraded → down) does not re-trigger an alert, and a component stuck down for hours doesn't page repeatedly — only the initial transition does. Recovery (degraded/down → healthy) is also silent; nothing notifies admins when a component comes back.
When a transition fires, every active platform admin gets two notifications:
- An in-app
Notification— category SYSTEM,requires_action: true, linking back to/platform/status. - An email with subject
[GreekManage] {component} is {new_status}(for example,[GreekManage] Database is down).
Email delivery failures during an alert are swallowed (fail-silently) on purpose — a broken outbound-mail configuration should never be able to crash the health-check pipeline itself. The in-app notification always fires regardless of whether the email succeeds.
Push delivery health
Platform → Push Health (/platform/push-health) is a dedicated sub-page for push-notification delivery, linked from the Push notifications integration tile above.
Page title "Push delivery health", subtitle "24-hour rolling window of push notification send attempts per provider. Auto-refreshes every minute." Like the main dashboard, it polls every 60 seconds.
Two provider buckets are shown side by side:
- iOS (APNs)
- Android (FCM)
Each bucket shows a rolling 24-hour success rate, color-coded green at ≥95%, amber at ≥70%, red below 70%, and an em-dash (—) when there's no data to compute a rate from. The success-rate formula is:
success rate = success / (success + unregistered + transient_failure)
Skipped (no credentials) and suppressed (user preference) attempts are deliberately excluded from that denominator — otherwise a "0 sends, no credentials configured" bucket would misreport as a 0% success rate instead of showing no rate at all.
Below the rate, each bucket shows a 6-box stat grid:
- Attempts
- Success
- Unregistered
- Transient
- Skipped (no creds)
- Suppressed (pref)
If a bucket has zero total attempts and at least one send was skipped for missing credentials, an amber notice explains that sends were skipped because provider credentials aren't configured on the running instance — so you don't mistake "never tried" for "silently failing."
An explainer card on the page spells out two distinctions worth remembering:
- Unregistered tokens are auto-deactivated; the user's next install or login re-registers a fresh token — this is expected lifecycle churn, not a failure to chase.
- Suppressed means the user turned off push for that specific event type in their own notification preferences — it is explicitly not a delivery failure, and shouldn't be read as one when triaging a low success rate.
What's not built today
- No historical view beyond the retention windows. Core infrastructure keeps 48 hours of snapshots (displayed as a 24h window); push delivery and API throughput are rolling 24h/1h windows respectively. There's no way to look further back from this dashboard.
- No per-organization health drill-down. Every check here is platform-wide; you cannot filter or scope any of it to a single tenant.
- No configurable alert thresholds. Every numeric threshold on this page (queue depth, CPU/memory %, disk %, connection %, latency ms, success-rate %) is fixed in code. There is no admin-facing setting to tune them.
Related
- Platform status dashboard (developer reference) — the implementation-level reference for this same feature: snapshot cadence, model names (
PlatformHealthSnapshot,PlatformBeatJobRun), and the underlying check/aggregator/alert modules. - Managing platform admins — who gets access to this dashboard in the first place.
- Audit logs — a separate, complementary record of who changed what; the status dashboard reports infrastructure health, not admin actions.
Last verified against v0.65.25 (2026-07-05). Platform health/status dashboard shipped v0.65.13; previously undocumented for platform admins.